Today’s applications are running on highly distributed infrastructure, and it is super complex to detect the failures and act on them in a reasonable time. Therefore, application monitoring is essential for the observability of a system.
In my personal experience, a legit monitoring setup should let you know if a system is performing correctly.
A visual dashboard that shows the application performance metrics and business metrics and points the bottlenecks out for detecting system failures.
In this tutorial, I will explain how to set up Prometheus on top of a Quarkus application and visualize metrics in Grafana.
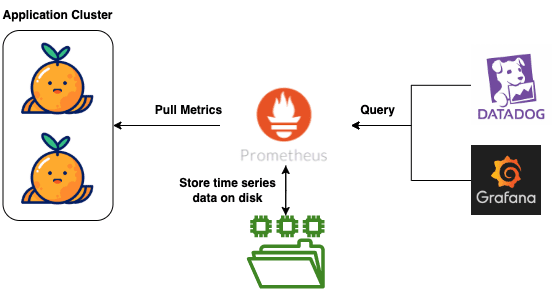
Prometheus is an open-source project mainly focused on metrics and alerting. It stores time-series data and exposes it for different purposes.
Grafana is an open-source analytics & monitoring tool that enables you to visualize metrics.
How does Grafana or Datadog work with Prometheus?
I’m writing this tutorial with the prerequisites below;
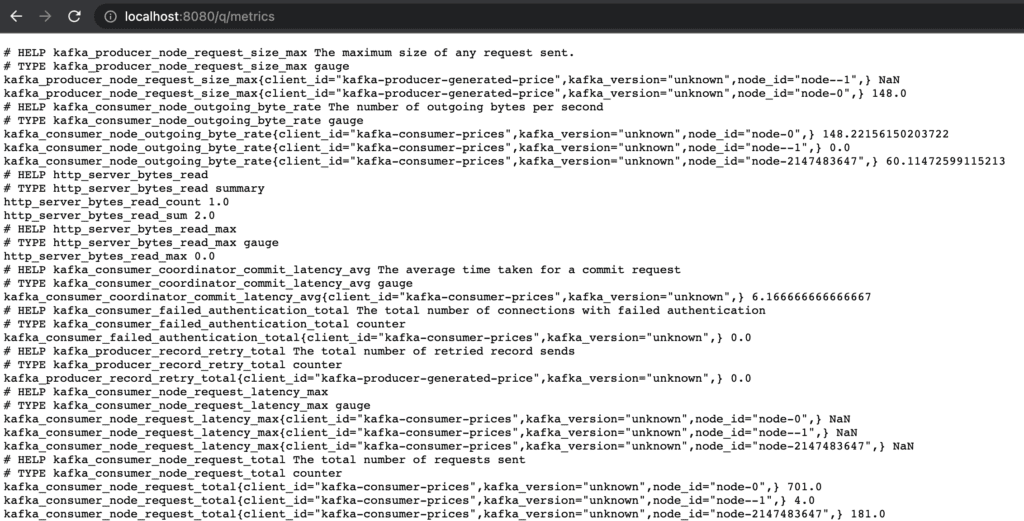
Since my quarkus-blog application contains a Kafka setup, you will see default metrics for Kafka, JVM, and HTTP server requests.
Run Prometheus server in Docker
Pull Prometheus docker image with the following command; For all Docker images check out Prometheus Docker Hub
docker pull prom/prometheus
To be able to configure Prometheus settings create a prometheus.yaml file.
					# my global config
global:
 scrape_interval:     15s # Set the scrape interval to every 15 seconds. Default is every 1 minute.
 evaluation_interval: 15s # Evaluate rules every 15 seconds. The default is every 1 minute.
 # scrape_timeout is set to the global default (10s).

# Load rules once and periodically evaluate them according to the global 'evaluation_interval'.
rule_files:
# - "first_rules.yml"
# - "second_rules.yml"

# A scrape configuration containing exactly one endpoint to scrape:
# Here it's Prometheus itself.
scrape_configs:
 # The job name is added as a label `job=<job_name>` to any timeseries scraped from this config.
 - job_name: 'prometheus'
   # metrics_path defaults to '/metrics'
   # scheme defaults to 'http'.
   static_configs:
     - targets: ['127.0.0.1:9090']

 - job_name: 'quarkus-micrometer'
   metrics_path: '/q/metrics'
   scrape_interval: 3s
   static_configs:
     - targets: ['HOST:8080']
In the above example, we created a job called quarkus-micrometer that scrapes the ‘/q/metrics’ endpoint every 3 seconds. Please keep in mind our application exposes the ‘/q/metrics’ endpoint.
As we are running the Prometheus server on the Docker container, you need to replace the HOST with your machine Ip.
Start the prom/prometheus docker container with followed command;


2 Responses
Do you have any SLO dashboard for this application ?