Today’s applications are running on highly distributed infrastructure, and it is super complex to detect the failures and act on them in a reasonable time. Therefore, application monitoring is essential for the observability of a system.
In my personal experience, a legit monitoring setup should let you know if a system is performing correctly.
- A visual dashboard that shows the application performance metrics and business metrics and points the bottlenecks out for detecting system failures.
In this tutorial, I will explain how to set up Prometheus on top of a Quarkus application and visualize metrics in Grafana.
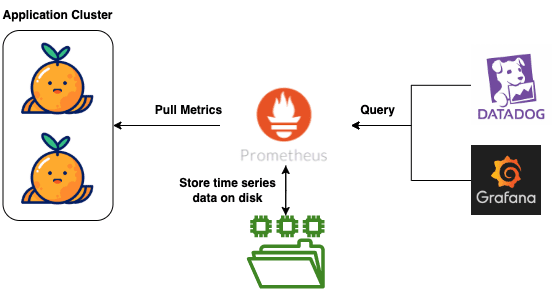
Prometheus is an open-source project mainly focused on metrics and alerting. It stores time-series data and exposes it for different purposes.
Grafana is an open-source analytics & monitoring tool that enables you to visualize metrics.
How does Grafana or Datadog work with Prometheus?

I’m writing this tutorial with the prerequisites below;
- You have Docker installed, up and running!
If you are new to Quarkus, I recommend starting with my previous post, Welcome to Quarkus: Supersonic, Kubernetes-Native Java Framework.
Check out the complete source code for Prometheus and Grafana monitoring from the Exceptionly Github account – quarkus-blog repository.
Enable Quarkus Application Metrics
To enable the metrics for a Quarkus application; add micrometer-registry-prometheus dependency in pom.xml
					<dependency>
<groupId>io.quarkus</groupId>
<artifactId>quarkus-micrometer-registry-prometheus</artifactId>
</dependency>
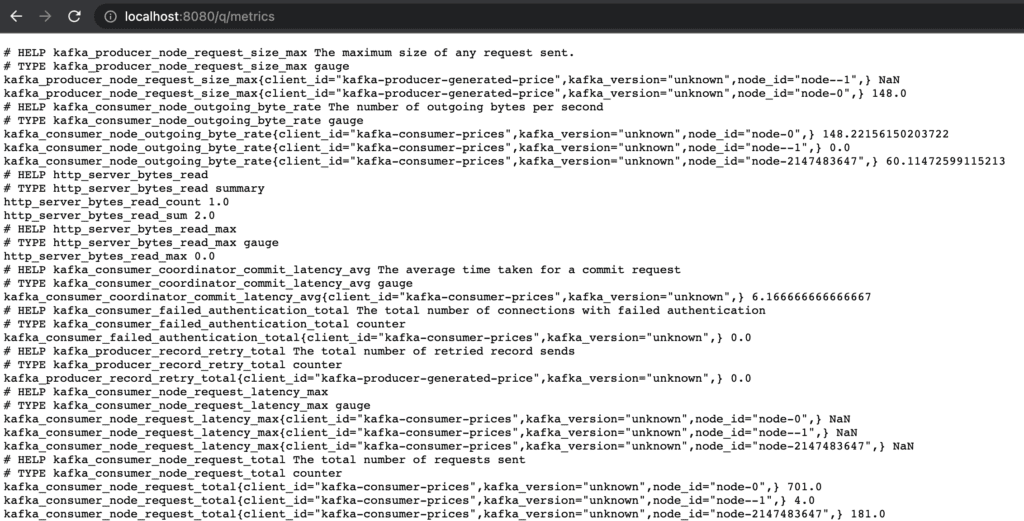
Build and start the application to expose metrics by default on http://localhost:8080/q/metrics endpoint.
Since my quarkus-blog application contains a Kafka setup, you will see default metrics for Kafka, JVM, and HTTP server requests.

Run Prometheus server in Docker
Pull Prometheus docker image with the following command; For all Docker images check out Prometheus Docker Hub
docker pull prom/prometheus
To be able to configure Prometheus settings create a prometheus.yaml file.
					# my global config
global:
 scrape_interval:     15s # Set the scrape interval to every 15 seconds. Default is every 1 minute.
 evaluation_interval: 15s # Evaluate rules every 15 seconds. The default is every 1 minute.
 # scrape_timeout is set to the global default (10s).

# Load rules once and periodically evaluate them according to the global 'evaluation_interval'.
rule_files:
# - "first_rules.yml"
# - "second_rules.yml"

# A scrape configuration containing exactly one endpoint to scrape:
# Here it's Prometheus itself.
scrape_configs:
 # The job name is added as a label `job=<job_name>` to any timeseries scraped from this config.
 - job_name: 'prometheus'
   # metrics_path defaults to '/metrics'
   # scheme defaults to 'http'.
   static_configs:
     - targets: ['127.0.0.1:9090']

 - job_name: 'quarkus-micrometer'
   metrics_path: '/q/metrics'
   scrape_interval: 3s
   static_configs:
     - targets: ['HOST:8080']
In the above example, we created a job called quarkus-micrometer that scrapes the ‘/q/metrics’ endpoint every 3 seconds. Please keep in mind our application exposes the ‘/q/metrics’ endpoint.
As we are running the Prometheus server on the Docker container, you need to replace the HOST with your machine Ip.
Start the prom/prometheus docker container with followed command;
docker run -d --name prometheus -p 9090:9090 -v <PATH_TO_PROMETHEUS_YML_FILE>/prometheus.yml:/etc/prometheus/prometheus.yml prom/prometheus --config.file=/etc/prometheus/prometheus.yml
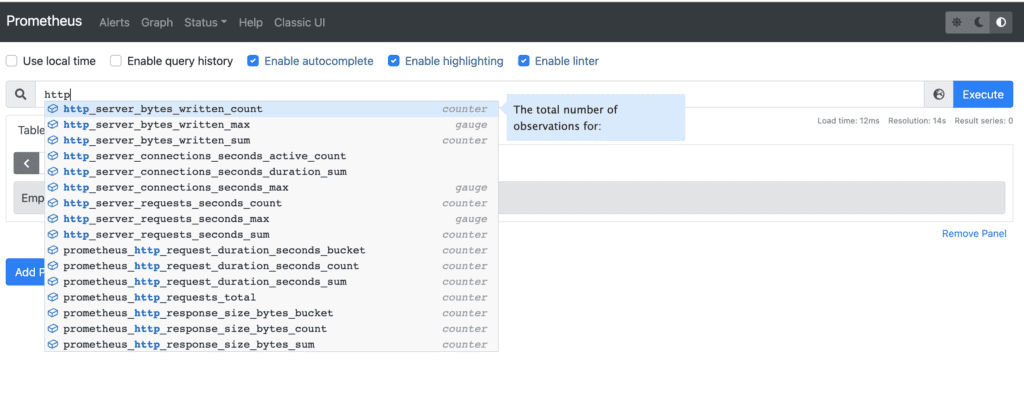
Navigate http://localhost:9090/ to check out Prometheus default UI. You can see the list of available metrics that are exposed by the application.

Configure Prometheus monitoring server with Grafana
The below command will pull the Grafana docker image and start a container on top of this image.
docker run -d --name grafana -p 3000:3000 grafana/grafana
The Grafana is accessible from http://localhost:3000/
Connect Grafana to Prometheus with followed steps
- Click “Data Sources” in the sidebar.
- Choose “Add New”.
- Select “Prometheus” as the data source.
- Place your machine IP address in the HTTP URL input
- Verify new data source with Save & test button
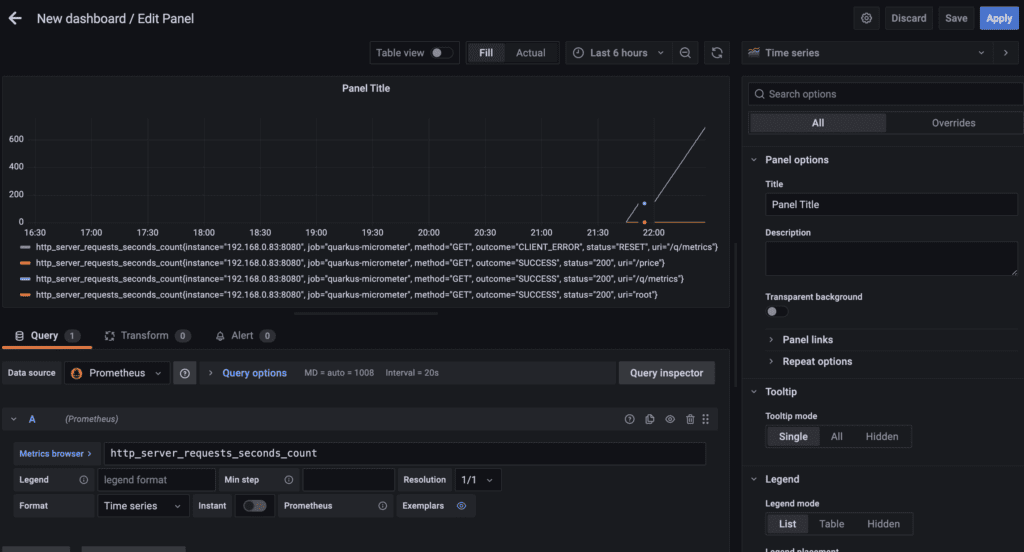
Congrats are in order; create a panel in Grafana Dashboard with your favorite metrics.

Exceptionly blog has excellent tutorials for challenging languages or tools.
Feel free to explore my other posts;

2 Responses
Do you have any SLO dashboard for this application ?